Lab 3: Memory management and debugging tools
You do NOT need to submit this assignment. You should pay attention to it carefully as it explaining tools you are going to use in your Computer Architecture class and in your first project!
Objectives
The goals of this lab are to:
- Review the quiz
- Get familiar with Valgrind
- Use Valgrind to check if the memory was freed or not
- Review GDB
Valgrind
Find a tutorial on Valgrind and how to use it here.
Valgrind is a memory mismanagement detector. It shows you memory leaks, deallocation errors, etc. Actually, Valgrind is a wrapper around a collection of tools that do many other things (e.g., cache profiling); however, here we focus on the default tool, memcheck.
Memcheck can detect:
- Use of uninitialized memory
- Reading/writing memory after it has been free’d
- Reading/writing off the end of malloc’d blocks
- Reading/writing inappropriate areas on the stack
- Memory leaks – where pointers to malloc’d blocks are lost forever
- Mismatched use of malloc vs free
Consider this C program:
#include <stdio.h>
#include <stdlib.h>


int main () {
    // Declare 2 pointers of type int
    int *a = NULL;
    int *b = NULL;

    // Allocate memory
    a = (int*) malloc (sizeof(int)*100);
    b = (int*) malloc (sizeof(int));

    // Populate the array a with some data
    int i = 0;
    for (i = 0; i < 100; i++){
            a[i] = i + 1;
    }

    // Print to the screen the values in the array before freeing the memory
    printf("BEFORE free\n");
    i = 0;
    for (i = 0; i < 100; i++){
        printf("%d ", a[i]);
    }
    printf("\n---------------------------\n");

    free(a); // Free the memory for a

    // What is in the memory after free?
    // NOTE: this is BAD practice, only for demo purposes
    printf("AFTER free\n");
    i = 0;
    for (i = 0; i < 100; i++){
        printf("%d ", a[i]);
    }
    // Forgot to free the memory for b?
    return 0;
}
Exercise 1: Without running this code, what do you think is in the memory after
free(a)?
Exercise 2: Compile and run the
main.con repl.it. What happens? Do you get an error? Does this have any memory leaks?
How to use Valgrind
Valgrind is available on repl.it.
Compile your program with -g to include debugging information so that Memcheck’s error messages include exact line numbers.
gcc -g -o memory main.c
To run your program under Memcheck:
valgrind --leak-check=yes ./memory
Memcheck is the default tool. The --leak-check option turns on the detailed memory leak detector. Memcheck will issue messages about memory errors and leaks that it detects.
The error messages will look like:
==1438== Memcheck, a memory error detector
==1438== Copyright (C) 2002-2017, and GNU GPL'd, by Julian Seward et al.
==1438== Using Valgrind-3.13.0 and LibVEX; rerun with -h for copyright info
==1438== Command: ./memory
==1438==
BEFORE free
1 2 3 4 5 6 7 8 9 10 11 12 13 14 15 16 17 18 19 20 21 22 23 24 25 26 27 28 29 30 31 32 33 34 35
36 37 38 39 40 41 42 43 44 45 46 47 48 49 50 51 52 53 54 55 56 57 58 59 60 61 62 63 64 65 66 67
68 69 70 71 72 73 74 75 76 77 78 79 80 81 82 83 84 85 86 87 88 89 90 91 92 93 94 95 96 97 98 99
100
---------------------------
AFTER free
==1438== Invalid read of size 4
==1438==    at 0x4006E6: main (memory.c:35)
==1438==  Address 0x5203040 is 0 bytes inside a block of size 400 free'd
==1438==    at 0x4C2ACBD: free (vg_replace_malloc.c:530)
==1438==    by 0x4006B7: main (memory.c:28)
==1438==  Block was alloc'd at
==1438==    at 0x4C29BC3: malloc (vg_replace_malloc.c:299)
==1438==    by 0x40060E: main (memory.c:11)
==1438==
1 2 3 4 5 6 7 8 9 10 11 12 13 14 15 16 17 18 19 20 21 22 23 24 25 26 27 28 29 30 31 32 33 34 35
36 37 38 39 40 41 42 43 44 45 46 47 48 49 50 51 52 53 54 55 56 57 58 59 60 61 62 63 64 65 66 67
68 69 70 71 72 73 74 75 76 77 78 79 80 81 82 83 84 85 86 87 88 89 90 91 92 93 94 95 96 97 98 99
100
==1438==
==1438== HEAP SUMMARY:
==1438==     in use at exit: 4 bytes in 1 blocks
==1438==   total heap usage: 2 allocs, 1 frees, 404 bytes allocated
==1438==
==1438== 4 bytes in 1 blocks are definitely lost in loss record 1 of 1
==1438==    at 0x4C29BC3: malloc (vg_replace_malloc.c:299)
==1438==    by 0x40061C: main (memory.c:12)
==1438==
==1438== LEAK SUMMARY:
==1438==    definitely lost: 4 bytes in 1 blocks
==1438==    indirectly lost: 0 bytes in 0 blocks
==1438==      possibly lost: 0 bytes in 0 blocks
==1438==    still reachable: 0 bytes in 0 blocks
==1438==         suppressed: 0 bytes in 0 blocks
==1438==
==1438== For counts of detected and suppressed errors, rerun with: -v
==1438== ERROR SUMMARY: 101 errors from 2 contexts (suppressed: 0 from 0)
This example shows the use of reading memory after it has been free’d and memory leaks.
Exercise 3: Try to compile and run the program with Valgrind memcheck options. Explain the output that you see (should be similar to the one above).
Exercise 4: Modify the code in
memory2.cso Valgrind doesn’t show any more memory errors. Show the output from Valgrind.
GDB review
Find a video tutorial on gdb and how to use it here.
Let’s start with by looking at this program from C-1 module gdb1.c:
int main()
{
  int i = 5;
  char* charPtr;
  int j;

  // Make the char pointer point to the start of the integer:
  charPtr = (char*) (&i);

  // Extract the byte, store it in the integer j and print j.
  j = (int) *charPtr;
  printf("First byte: %d\n", j);

  // Get the next byte and print:
  j = (int) *(charPtr+1);
  printf("Second byte: %d\n", j);

  // Get the third byte and print:
  j = (int) *(charPtr+2);
  printf("Third byte: %d\n", j);

  // Get the fourth byte and print:
  j = (int) *(charPtr+3);
  printf("Fourth byte: %d\n", j);
}
-
We are going to load this program into
gdbto get more information about what is going on in the background. -
In order to do this we need to compile the program with a special flag:
gcc -o ptrExample ptrExample.c -g gdb
Exercise 5: Why is this flag necessary? What happens if you don’t use it? Hint: you may need to play around with some of the later commands or watch the tutorial video to find out.
- After compiling the program, load it into gdb with the command
gdb ptrExample. - Make sure to use the executable name, and not the name of the C file when loading into gdb.
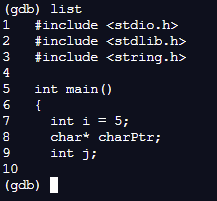
List
Use list or l to view the first 10 lines of the program. Running this again will show the second 10 lines, and so on.
Break
Use the break command to create “breakpoints” in the program. These will halt the program at the indicated line number and allow you to step through the program line-by-line after that.
break [line-number]will create a breakpoint at the given line.info breakpointswill display all the breakpoints you have created and what number each of them is.-
delete [breakpoint-number]will remove a certain breakpoint. Note: the breakpoint-number is the breakpoint’s number in the list displayed by info, NOT the line number it was created at.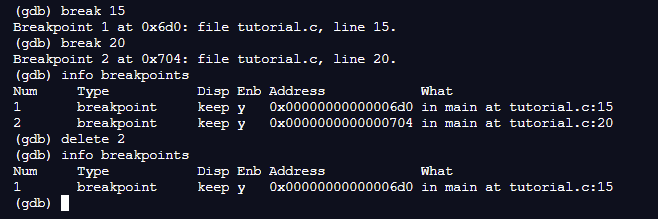
Use the print [var], or p [var] for short, command to print out the value of a specified variable.
Alternatively, you can use the command watch [var] to receive printed out before-and-after values of the variable whenever it changes.
Using GDB for Debugging
Here is a modified version of our program from before gdb2.c:
int main()
{
  int arr[10];
  int i = 5;
  char* charPtr;
  char* ptr2;
  int j;

  for (j = 0; i <= 10; i++) {
    arr[i] = i;
  }

  // Make the char pointer point to the start of the integer:
  charPtr = (char*) (&i);

  // Extract the byte, store it in the integer j and print j.
  j = (int) *charPtr;
  printf("First byte: %d\n", j);

  // Get the next byte and print:
  j = (int) *(charPtr+1);
  printf("Second byte: %d\n", j);

  // Get the third byte and print:
  j = (int) *(charPtr+2);
  printf("Third byte: %d\n", (int)ptr2);

  // Get the fourth byte and print:
  j = (int) *(charPtr+3);
  printf("Fourth byte: %d\n", j);
}
Exercise 6: Write this program, compile it, and run it. What result do you get?
Exercise 7: There are two bugs in this program that will cause it to crash. Use the
backtracecommand in gdb to view the stack history and paste it as part of your answer to this exercise. What line numbers are causing the program to fail? See if you can fix the errors so that the program will run all the way through.
Quiz review
Last class you were presented with this quiz:
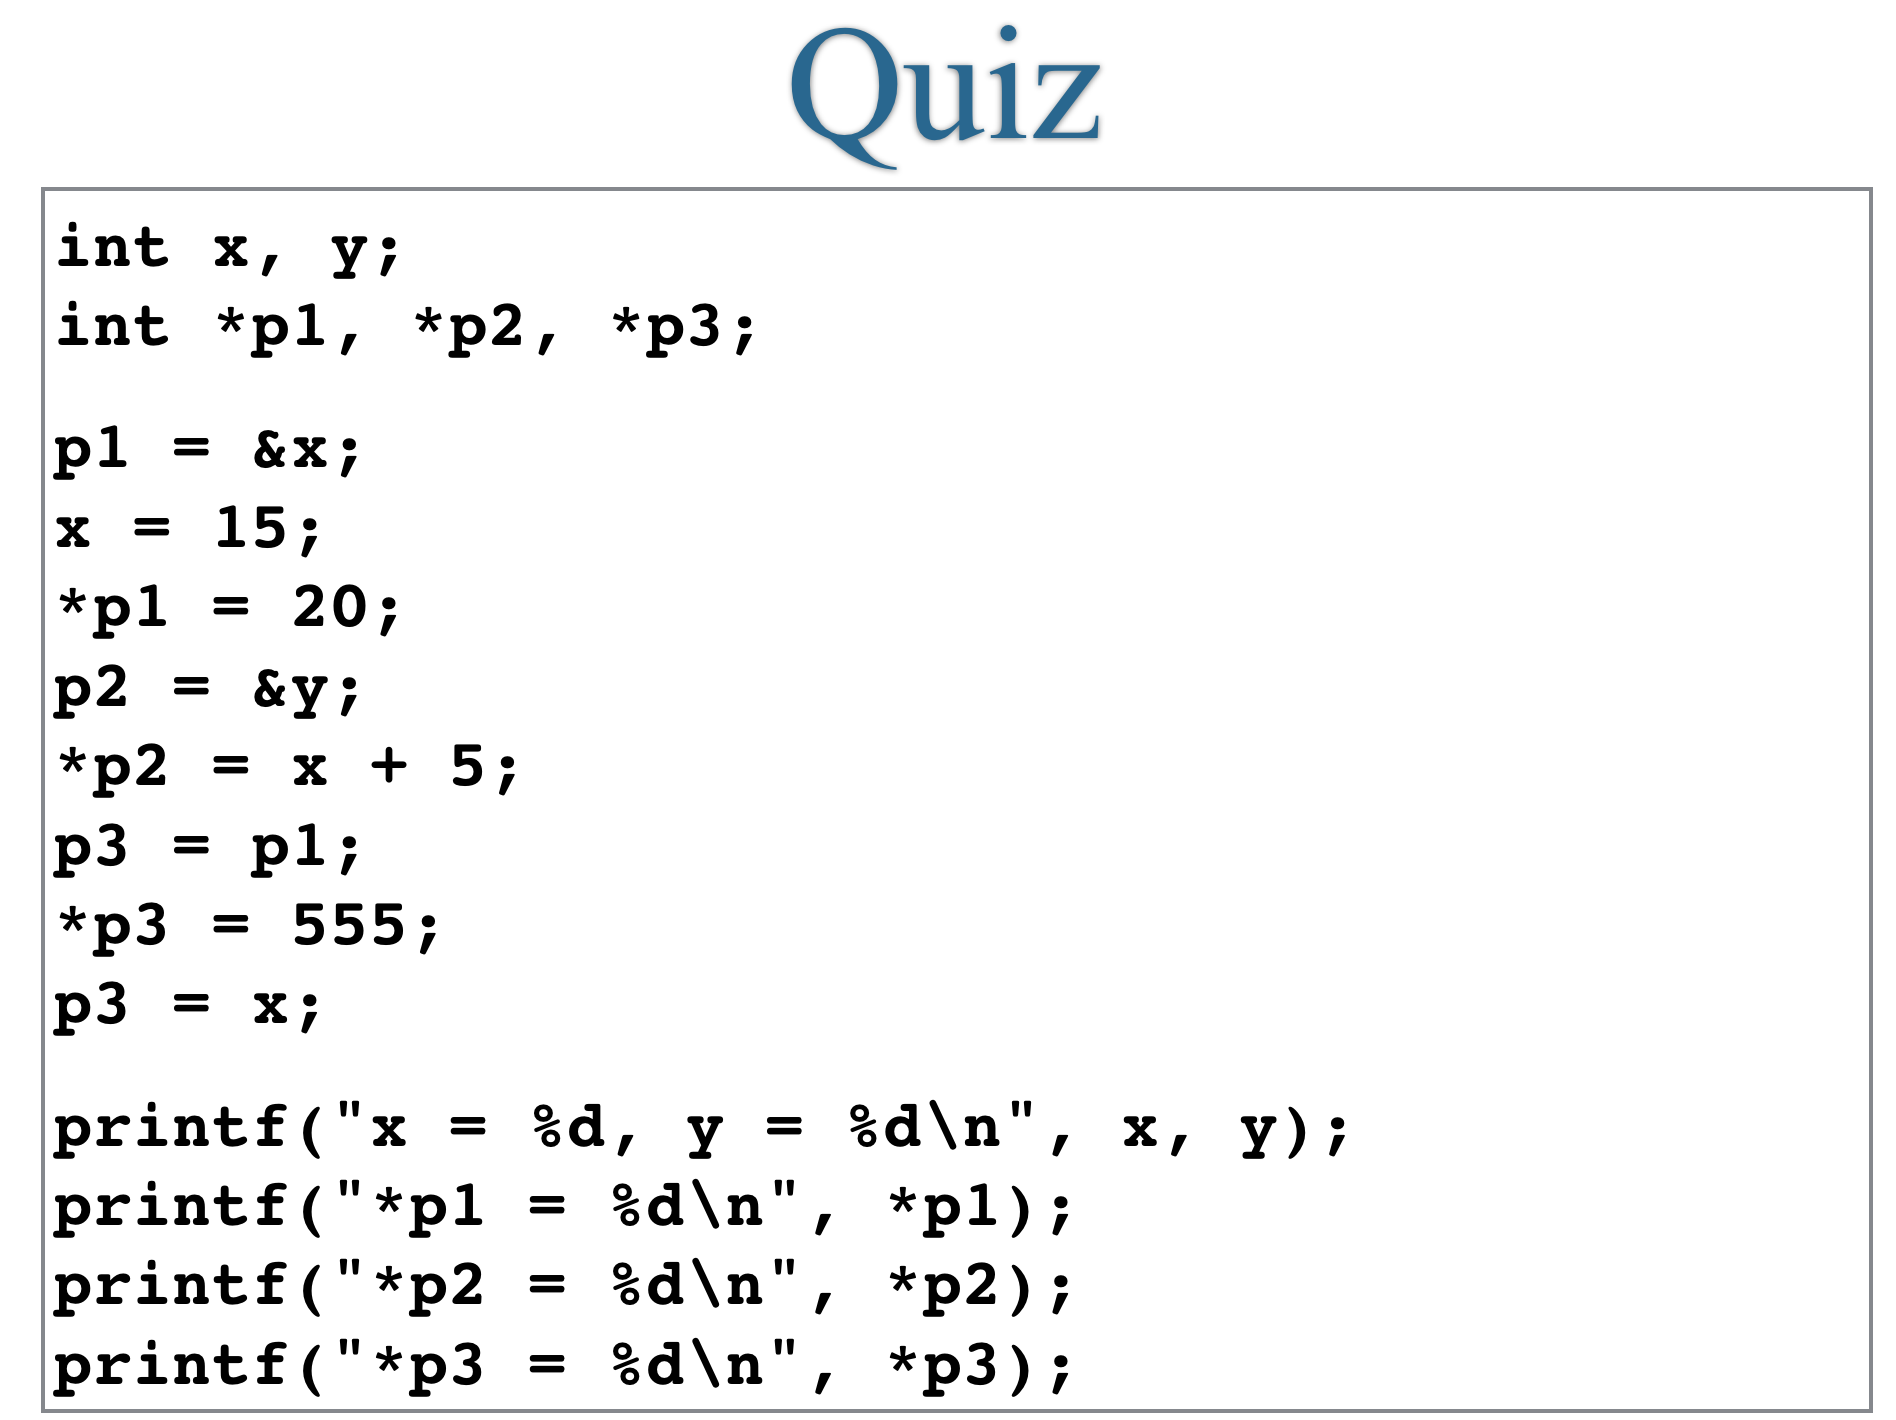
Let’s run it line by line to see what is happening in memory:


